
Knowledge Base: ERP
Abas bietet passgenaue ERP-Software ✓ Für den Mittelstand ✓ Umfassende Funktionen ✓ Unkomplizierte Upgrades ✓ Einfache Anpassungen
Type: Vendor Profile

Airtable is a low‒code platform to build next‒gen apps. Move beyond rigid tools, operationalize your critical data, and reimagine workflows with AI.
Type: Vendor Profile
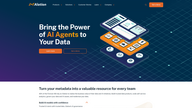
Alation enables organizations to scale data initiatives more efficiently and advance new AI initiatives. Discover how we can bring the power of agentic AI to you data.
Type: Vendor Profile
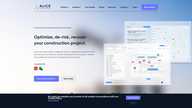
Knowledge Base: AI Scheduling
ALICE is a construction schedule optimization platform that enables contractors and owners to optimize, de-risk and recover construction projects with AI
Type: Vendor Profile
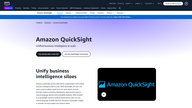
Knowledge Base: BI
Amazon QuickSight is a cloud-native, serverless, business intelligence (BI) with native machine learning (ML) integrations and usage-based pricing, allowing insights for all users.
Type: Vendor Profile ,
, ,
, ,
, ,
, ,
, ,
, ,
, ,
, ,
,